
REIT Distributions vs. Stock Dividends: Why the Headline Yield Is Only the Start
A publicly traded REIT and a conventional dividend stock can show the same yield while generating and funding their payouts in different ways. See how to compare the cash behind each payment, read its federal tax classification, and account for share-price changes.
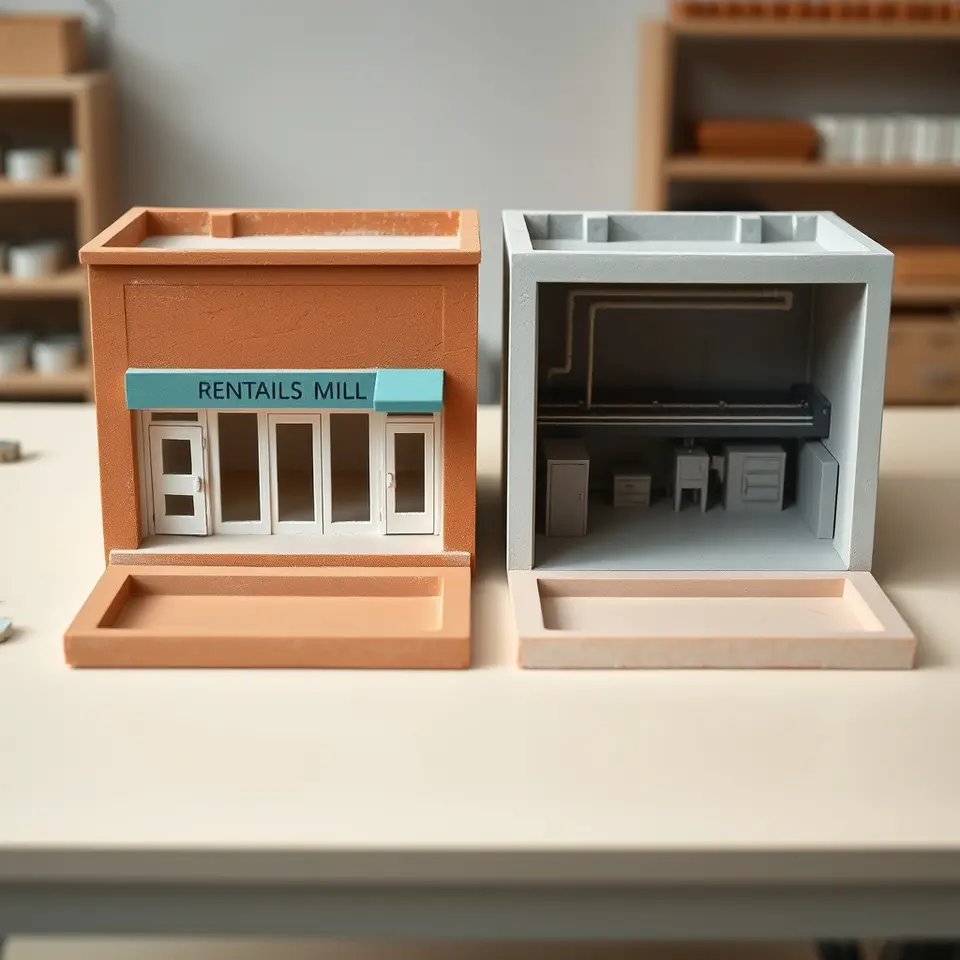
A publicly traded real estate investment trust and a conventional dividend stock both trade at $40 and pay $2 per share over the past year. Each shows a 5% trailing yield. One earns rent and spends money to keep its buildings occupied. The other sells products and spends money to keep its factories running. Shareholders received the same amount per share, but the businesses had different bills to pay before they could sustain those payments.
When comparing REIT distributions vs dividends, the headline yield answers one question about the size of the payout relative to the share price. The rest of the comparison depends on how each business funds the payment, how the payment is reported for federal tax purposes, and what happens to the value of the shares. The focus here is common shares of publicly traded U.S. equity REITs that own income-producing property and conventional U.S. corporations that pay cash dividends. All figures are hypothetical.
What the headline yield measures
Trailing yield divides the cash paid per share over the prior 12 months by the current share price. An indicated annual yield often takes the latest regular payment and annualizes it. A quarterly payment of $0.50, for example, implies $2 a year if that payment repeats. At $40 per share, both methods give 5% when each of the last four payments was $0.50. The figures can diverge after a dividend change or a special distribution.
Suppose the REIT’s share price falls from $40 to $32 while its annual payout remains $2. Its trailing yield rises to 6.25%, with the entire increase coming from the lower share price. If the next four quarterly payments are cut to $0.35, the indicated annual payout becomes $1.40 and the indicated yield at $32 is about 4.4%. The trailing figure can still reflect the previous, higher payments. Both figures describe the same stock, using different payment periods.
A special payout can also raise a trailing yield. If either company paid $2 in regular dividends and a one-time $1 distribution, its trailing yield at $40 would be 7.5%. The regular payments would account for 5 percentage points of that figure. The distribution history shows whether the difference came from a higher regular payment or a one-time event, such as the sale of a property or business unit.
How much cash supports the payout?

A conventional corporation’s board generally has discretion over its dividend policy. A business with steady operating cash flow can pay shareholders and retain cash for equipment, expansion, or debt repayment. An equity REIT also needs cash for its business, but federal REIT qualification generally requires it to distribute at least 90% of its REIT taxable income, calculated before the dividends-paid deduction and excluding net capital gain, subject to statutory adjustments.
That requirement applies to a tax calculation. Rental receipts, cash from operations, and reported net income each measure something different. A REIT can satisfy the rule and later reduce its regular dividend as earnings and cash needs change. A high payout ratio based on a separate performance measure also says little about compliance with the tax rule.
For equity REITs, read the adjustments behind FFO and AFFO
Accounting depreciation reduces reported earnings by allocating the cost of a building over time. The current period’s depreciation expense does not require a matching cash payment. Funds from operations, or FFO, generally adds back depreciation and amortization related to real estate and removes gains or losses from certain property sales, among other adjustments. That makes FFO a common starting point for looking at property operations across periods.
Buildings still need upkeep, and keeping space leased can take cash. Adjusted funds from operations, or AFFO, is a measure some REITs report that may account for recurring capital spending, tenant improvements, leasing commissions, and timing differences between rent recorded under accounting rules and rent collected. Definitions vary by issuer. One REIT may subtract a recurring cost that another leaves in the figure. The reconciliation and accompanying definitions show what each company included.
For conventional companies, compare earnings and cash coverage
Dividends per share divided by earnings per share gives an earnings payout ratio. It shows how much of reported profit the company paid out. The cash flow statement provides a second view. One common definition of free cash flow is operating cash flow minus capital expenditures, the spending on long-lived assets such as buildings and equipment. Dividing common dividends by same-period free cash flow shows how much of that cash measure went to common shareholders.
Cash flow can fluctuate with timing. A manufacturer that builds up inventory ahead of a busy season may temporarily use more cash even while sales hold up. A manufacturer that postpones equipment replacement may temporarily report stronger free cash flow. For a REIT, a large tenant’s departure can cut rent and raise leasing costs at the same time. Several reporting periods help put those changes in context.
What two 5% yields can conceal
Consider a hypothetical property REIT and a hypothetical manufacturer. Both paid $2 per common share over the past year, and both trade at $40. Their figures below refer to the same 12-month period, with the cash measures expressed per common share for illustration.
| Measure | Equity REIT | Manufacturer |
|---|---|---|
| Share price | $40.00 | $40.00 |
| Cash paid per common share | $2.00 | $2.00 |
| Trailing yield | 5.0% | 5.0% |
| Cash measure used in this example | $2.40 in reported AFFO per share | $3.20 in free cash flow per share |
| Payout as a share of that measure | About 83% | 62.5% |
| Amount by which the measure exceeds the payout | $0.40 per share | $1.20 per share |
The manufacturer has more room between its payout and its chosen cash measure in this example. The two denominators use different accounting conventions, so the percentages alone cannot establish which payout is more durable. The manufacturer could face a costly equipment replacement or a decline in orders. The REIT could collect steady rent yet face a refinancing at higher interest costs. Debt maturities matter because repaying or refinancing principal can strain cash even when current operating results look steady.
Hold each payout at $2 for a simple sensitivity test. If each cash measure falls by $0.50 per share, the REIT’s illustrative ratio rises to about 105% of AFFO, while the manufacturer’s rises to about 74% of free cash flow. A ratio above 100% means the payout exceeded the measure used during that period. Cash reserves, borrowing, or asset sale proceeds can help bridge a shortfall. A recurring shortfall and a single unusual quarter raise different questions about how the payment is funded.
How federal tax treatment can change the comparison
In a taxable U.S. brokerage account, cash dividends from a conventional domestic corporation may qualify for preferential federal tax rates if the dividend and the shareholder meet the applicable requirements, including holding-period rules. Qualified dividends are included in ordinary dividends on Form 1099-DIV and are also identified separately. A conventional corporation can also make a payment that is classified as a nondividend distribution.
A REIT payment can contain several tax components. Its ordinary dividend portion is generally taxed at ordinary income rates, although eligible shareholders may be able to claim a federal deduction for reported qualified REIT dividends. The phrase qualified REIT dividends refers to a separate tax category from qualified dividends eligible for preferential rates. A REIT can also report capital gain distributions or classify part of a payout as a nondividend distribution, commonly called return of capital.
Suppose the hypothetical REIT reports its $2 payment as $1.40 in ordinary dividends, $0.35 in capital gain distributions, and $0.25 in return of capital. The shareholder received $2 in cash. For a share with an initial tax basis of $40, the $0.25 return of capital generally reduces the basis to $39.75. Tax basis is the amount used to calculate taxable gain or loss on a later sale. Once basis reaches zero, additional return of capital generally produces a capital gain. That classification describes the payment’s tax treatment. The cash flow statement and payout reconciliation help explain how the REIT funded it.
Two investors who receive identical cash payouts can therefore have different federal tax outcomes. Form 1099-DIV and any corrected form show the reported categories for the tax year. The quoted market yield is a pretax figure and can be calculated before the year’s final payment classifications are available.
Compare the payout with the change in share value
Total return combines investment income and the change in share price. In a simple one-year calculation before taxes and fees, with no reinvestment, subtract the starting price from the ending price, add cash received per share, and divide by the starting price.
If the property REIT in the example starts at $40, pays $2, and ends at $36, the $4 price decline exceeds the cash received. The one-year total return is negative 5%. If the manufacturer starts at $40, pays the same $2, and ends at $42, the one-year total return is positive 10%. Those prices are hypothetical. They isolate the effect of share-price changes while holding the starting price and the cash payout constant.
The REIT’s ending trailing yield would be about 5.6% at $36. The manufacturer’s would be about 4.8% at $42. The higher ending yield and the lower holding-period return can occur together because each measure uses the share price differently. The trailing yield uses the ending price to describe the amount paid relative to today’s price. Holding-period return uses the starting price and counts the price change itself.
A repeatable way to compare payouts
- Put the yields on the same basis. Match the price date and payment period. Identify any special payments and distinguish cash already paid from a regular payment annualized at its latest rate.
- Trace the regular payout to the business. Use the REIT’s FFO and AFFO reconciliations, or compare a conventional company’s dividend with earnings and operating cash flow after capital spending. Look at what each measure leaves out and whether those items require cash.
- Read across reporting periods. Compare payout coverage with upcoming debt maturities and recurring cash needs. For a REIT, occupancy, lease expirations, and leasing costs help explain changes. For a manufacturer, order trends, inventory, and equipment spending can help explain them.
- Use the right figure for each question. Distribution history shows the cash paid, tax reporting shows how the payment was classified, and price history plus cash received shows the holding-period return.
A 5% yield puts two payments on the same scale at a given share price. The larger comparison comes from tracing each payment back to the business and forward to the shareholder. A payout reconciliation can reveal a narrow margin for a dividend, a tax form can show how much of the payment reduced basis, and the price history can show whether the cash covered a decline in share value.
By FinancemonkPublished
← More from the journal